

13 October 2026
.webp?format=pjpg&auto=webp&width=64&quality=75&branch=main)
Jack McKay
In this article
Jack’s Chart of the Day examines GBPJPY’s consolidation, rising 20-period EMA and supportive RSI. The analysis outlines the conditions for a potential move towards 211.500 and the downside implications of losing 206.500.
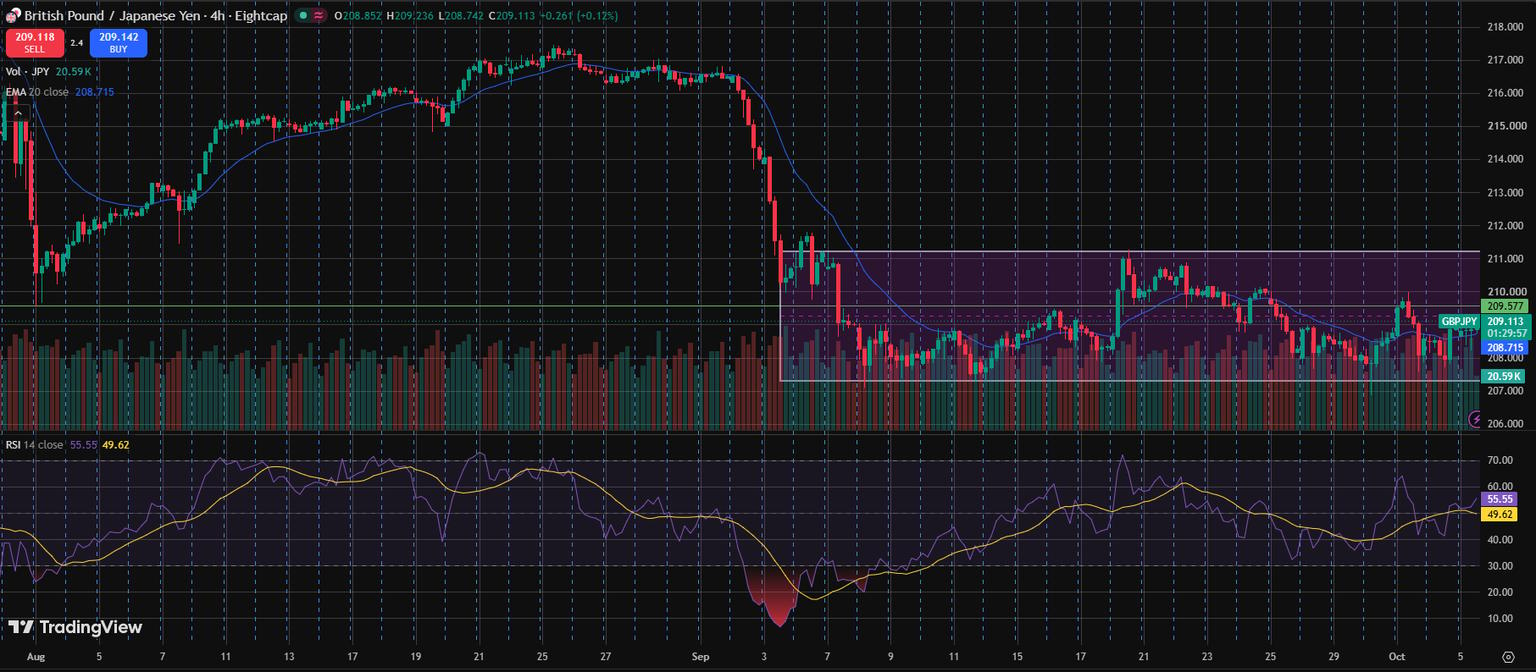
GBP/JPY, four-hour chart, Eightcap, 1 August to 5 October 2026. Features the 20-period EMA, RSI (14) with its 14-period SMA signal line and horizontal pivot levels. Chart of the Day edition: 6 October 2026.
Price pattern
GBP/JPY has spent the past two months carving out a massive ascending triangle accumulation structure beneath a critical multi-year supply ceiling. After bottoming during early August liquidations near 209.500, buyers drove an initial 790-pip impulse rally up to 217.400. A subsequent mid-September pullback formed a structural low at 209.200. Current price action is consolidating tightly around 208.86, compressing supply into a narrow 400-pip decision corridor between 207 and 211.
Technical levels
Moving averages remain in a bullish alignment, with the upward-sloping 20 EMA (208.7) offering dynamic support directly beneath the current spot rate. Momentum indicators reflect steady buyer dominance, as the 14-period RSI holds firm at 55.55 and sits above its 14 SMA signal line (49.62) without triggering overbought exhaustion. The primary upside target on a confirmed breakout resides at 211.500, representing a measured move expansion calculated from the 203.200 higher low. Immediate support is anchored by the 208.200 rotational pivot, with major structural backing layered below at 206.500.
Fundamentals
The cross is driven by the stark policy divergence between the Bank of England's hawkish "higher-for-longer" stance and the Bank of Japan's gradualist normalisation cycle. Sticky UK services inflation and resilient wage growth have forced money markets to price out near-term BoE rate cuts. Conversely, while the BoJ has exited negative rates, Japanese real yields remain negative, maintaining persistent carry-trade demand for GBP/JPY. Elevated global yields and steady energy prices continue to suppress domestic JPY appreciation, leaving counter-trend pullbacks aggressively bid.
Bottom line
The tactical read favors a bullish breakout expansion toward 211.500 as long as price holds above the 208.200 dynamic pivot shelf on a 4-hour close. A confirmed 4-hour candle close above 209.000 activates the continuation trade. Conversely, a daily close beneath 206.500 invalidates the immediate bullish structure and opens downside exposure toward the 203.200 higher-low base. Key catalysts to watch include upcoming UK GDP figures and BoJ monetary policy commentary.

.webp?format=pjpg&auto=webp&width=1536&quality=75&branch=main)
Jack McKay | Eightcap Risk Manager
Jack McKay is Eightcap's Simulated Trading Risk Manager.
Related articles

How does forex trading work?
New to forex? Learn how forex trading works in plain English, including currency pairs, price movements, CFDs, leverage and how to practise first.
17 August 2026

Trading the JPY Crosses
The foreign exchange (forex) market is the largest and most liquid financial market in the world, with trillions of dollars traded daily. Within this vast market, one of the most intriguing and frequently traded currency groups is the Japanese yen crosses, commonly referred to as JPY crosses. In this article, we will provide you with a detailed guide on trading the JPY crosses, offering insights into their unique characteristics, factors influencing their movements, and key strategies to consider when trading them.
31 August 2023
Trading the GBP Crosses
One popular avenue for forex traders is trading the GBP crosses. GBP, or the British pound, serves as a base or counter currency against other major currencies, such as the USD, EUR, JPY, and AUD, among others. In this article, we will explore the dynamics of trading the GBP crosses and provide valuable insights into effective trading strategies to increase your chances of effective trading.
3 September 2023


