

13 October 2026
.webp?format=pjpg&auto=webp&width=64&quality=75&branch=main)
Jack McKay
In this article
Jack’s Chart of the Day examines the Nasdaq 100’s expansion from consolidation into a rising channel. The analysis covers EMA support, overbought momentum and potential upside levels following a confirmed breakout.
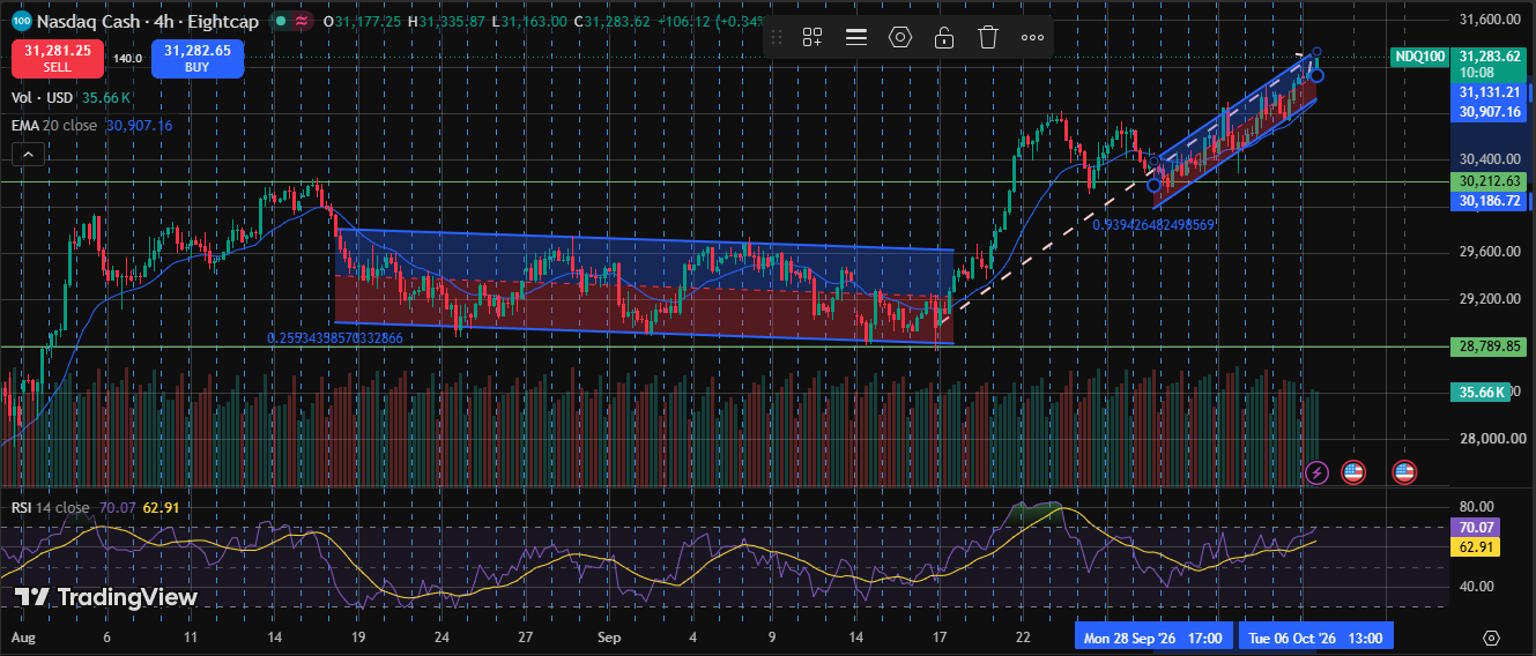
Nasdaq Cash (NDX100), four-hour chart, Eightcap, 3 August to 6 October 2026. Features the 20-period EMA, horizontal price levels, volume and RSI (14) with its 14-period SMA signal line. Chart of the Day edition: 7 October 2026.
Price pattern
The two-month structure traces a transition from a horizontal consolidation channel into a bullish ascending channel expansion. Throughout August and mid-September, price action remained bound within a multi-week sideways consolidation rectangle between $28,789.85 and $29,700.00. A breakout from this base on September 17 initiated an impulsive vertical expansion that crested near $30,700. Following a brief corrective retracement into late September that established a higher low at $30,186.72, buyers mounted an upward channel trajectory. The current 4-hour session shows price trading near the top rail of this ascending corridor at $31,283.62 (+0.34% / +106.12 points).
Technical levels
The technical setup reflects strong bullish momentum, with price ($31,283.62) maintaining its position well above the rising 20 EMA at 30,907.16. Immediate dynamic support is provided by the 20 EMA, backed by key horizontal support floors at $30,212.63 and $30,186.72. The lower channel boundary and the multi-month breakout floor at $28,789.85 serve as structural support. RSI (14) stands at 70.07, crossing above its 14 SMA signal line (62.91) and entering overbought territory, which indicates strong buyer control while signaling potential near-term consolidation around upper channel resistance.
Fundamentals
US growth equities continue to draw institutional capital inflows as global central bank easing expectations and resilient economic data cushion risk sentiment. Ongoing capital expenditure in artificial intelligence infrastructure and technological hardware continues to support benchmark growth indices. While elevated bond yields and central bank policy adjustments present intermediate headwinds, corporate balance sheet strength and forward earnings expectations maintain buyer demand on shallow dips.
Bottom line
The tactical read remains constructive while price holds above the 20 EMA (30,907.16) and the $30,186.72 structural floor. A confirmed 4-hour close above the upper channel resistance near $31,335.87 opens the path toward fresh psychological expansion targets at $31,500 and $32,000. Conversely, a break below 30,907.16 would signal a deeper pull-back toward the primary support shelf at $30,212.63.

.webp?format=pjpg&auto=webp&width=1536&quality=75&branch=main)
Jack McKay | Eightcap Risk Manager
Jack McKay is Eightcap's Simulated Trading Risk Manager.
Related articles

Eightcap's Guide to Index CFD Trading: Everything You Need to Know
Index CFD trading has emerged as a favored avenue for traders seeking exposure to diverse market movements. In this comprehensive guide, we’ll cover everything from understanding the basics of Index CFD trading to leveraging advanced trading tools offered by Eightcap, a multi-regulated broker known for its innovative tools and unwavering commitment to traders’ success. We’ll explore the nuances of Index CFD trading, popular index options, reasons to choose Eightcap for your trading needs, the benefits of Index CFD trading with Eightcap, and practical steps to get started with index CFD trading.
25 April 2024
The NASDAQ-100 Trading Approaches: Scalping, Intraday, and Swing Trading
Trading the NASDAQ-100, a stock market index that includes the top 100 non-financial companies listed on the NASDAQ exchange, offers a plethora of opportunities for traders. However, the approach taken can significantly impact the potential for profit and the level of risk involved.
24 October 2023
Mastering Speculation on Major US Indices: A Fundamental Research Guide
Unlocking the potential of CFDs in major US indices like the Dow Jones Industrial Average, Nasdaq Composite, and S&P 500 demands a profound understanding of their underlying dynamics. This guide delves into the fundamentals of these indices, tailored for CFD speculators aiming to navigate these volatile markets.
26 September 2021


