

13 October 2026
.webp?format=pjpg&auto=webp&width=64&quality=75&branch=main)
Jack McKay
In this article
Jack’s Chart of the Day examines crude oil’s rebound within a descending channel, improving RSI momentum and the support and resistance levels shaping potential breakout or rejection scenarios.
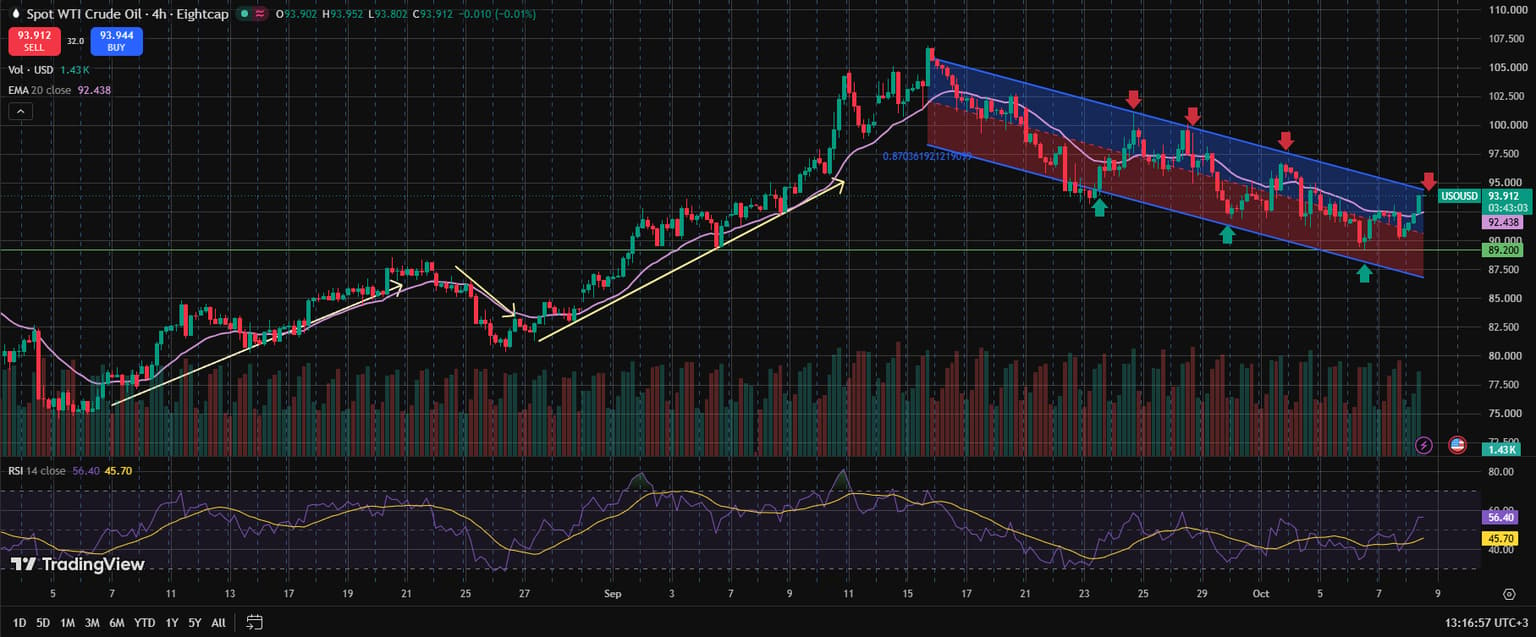
Crude oil (USOUSD), four-hour chart, Eightcap, early August to early October 2026. Features the 20-period EMA, RSI (14) with its 14-period SMA signal line, ascending trendlines and a descending channel. Chart of the Day edition: 9 October 2026.
Price pattern
Crude oil spent August pushing through an aggressive multi-leg bullish expansion, guided by sequential higher-low trendlines. The rally crested at a multi-month peak near 107.500 in mid-September, where price encountered aggressive institutional distribution. Since that high, price action has been strictly contained within a descending trend channel defined by parallel resistance and support rails. Lower highs have been consistently rejected along the upper blue channel rail (marked by red sell arrows), while lower lows have repeatedly found temporary demand along the lower blue rail (green buy arrows). After testing an October low near 89.200, crude staged a relief bounce toward the channel midline and is currently trading around 93.912, above the 20 EMA.
Technical levels
The primary technical structure is dominated by the descending channel that has capped price action since mid-September. The current spot price of 93.912 is trading above the 20 EMA at 92.438. Immediate overhead resistance sits at the upper channel rail near 95.000–96.000, aligning with recent rejection peaks. Beneath current levels, horizontal structural support sits at the key 89.200 floor, followed by the lower channel support rail near 86.500–87.500. RSI (14) sits at 56.40, crossing above its 14-period SMA signal line at 45.70 and reflecting short-term relief momentum within the overarching descending structure.
Fundamentals
The broader macro narrative driving crude oil continues to balance Middle East supply risks and potential shipping disruptions against weakening demand outlooks and increasing production from non-OPEC producers. While geopolitical friction keeps a persistent risk premium embedded in energy markets, ongoing inventory builds and macroeconomic headwinds across key importing regions continue to limit sustained upside, keeping price contained within a corrective channel. Market participants are closely watching upcoming central bank rate decisions and energy inventory reports for the next major directional catalyst.
Bottom line
The tactical outlook remains bound within the 4-hour descending channel. A confirmed 4-hour close above 95.000 would signal a channel breakout, opening a path toward 97.500 and a potential retest of $100.00. Conversely, rejection from the 95.000 ceiling would keep the bearish channel intact, bringing the 89.200 horizontal support floor and the 87.500 channel base back into focus as downside targets.

.webp?format=pjpg&auto=webp&width=1536&quality=75&branch=main)
Jack McKay | Eightcap Risk Manager
Jack McKay is Eightcap's Simulated Trading Risk Manager.
Related articles

How to trade Brent and WTI crude oil
Oil prices have been fluctuating over the past few months and have presented market opportunities for traders. Learn how to trade crude oil with this guide.
22 May 2020
What Affects the Price of Oil?
In the past week, we have seen increased volatility in oil prices. This certain commodity plays a greater role within the global economy. In this guide, we explain what influences oil prices. There are two primary factors which influence the price of oil on the commodity market: Supply and Demand Market Sentiment
29 May 2020
Short-term WTI Oil Trading Strategy
As a trader of West Texas Intermediate Oil CFD, performing solid fundamental and technical analyses are essential aspects of maximizing your chances of success.
27 April 2023


