

13 October 2026
.webp?format=pjpg&auto=webp&width=64&quality=75&branch=main)
Jack McKay
In this article
Jack’s Chart of the Day examines gold’s four-hour recovery, the approaching EMA crossover and the levels that could determine whether the rebound extends. Analysis dated 12 October 2026.
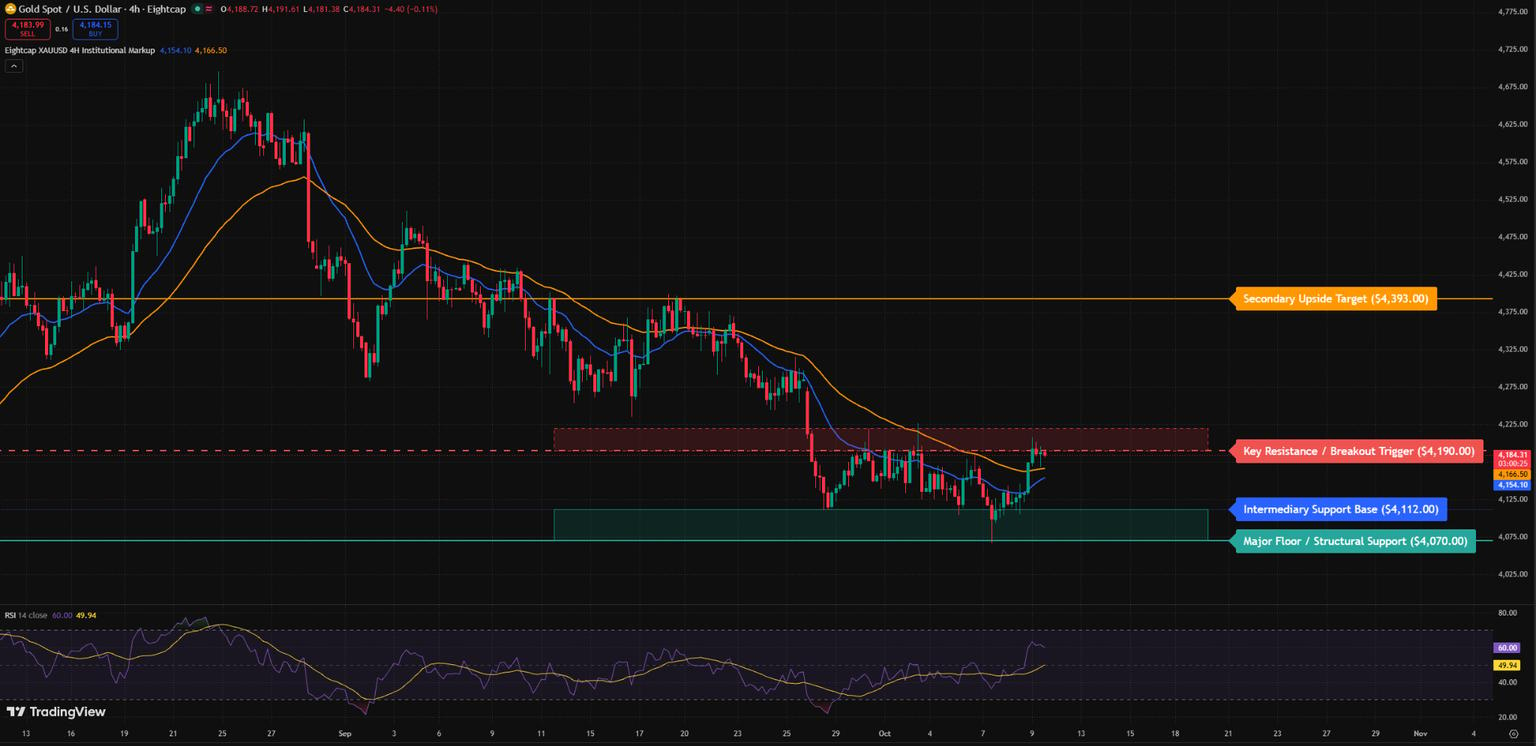
Spot gold (XAUUSD), four-hour chart, mid-August to October 2026. Includes the 20- and 50-period EMAs, horizontal support and resistance levels, target zones and RSI (14). Analysis dated 12 October 2026.
Price pattern
The price story over the past six weeks splits neatly into a sharp multi-week correction followed by an energetic structural bounce. After topping near the $4,650.00 handle in late August, gold endured a sustained 12.4% slide to a major double-bottom floor at $4,070.00 on October 7. Buyers defended $4,070.00 aggressively, engineering a 113-point recovery toward the $4,190.00 pivot. This recent expansion forms an intraday recovery sequence within the broader macro downtrend, with higher structural lows established at $4,112.00 on September 28 and October 8.
Technical levels
The single most critical feature on this chart is the impending bullish cross between the rising 20 EMA (4,154.03) and the flattening 50 EMA (4,166.47), directly beneath current price action at $4,183.51. Price is coiling against the key $4,190.00 resistance trigger and the $4,190.00 to $4,220.00 overhead supply box. Momentum firmly backs the bulls, with the 4-hour RSI (14) holding at 59.71, well above its 14-period signal line at 49.92, showing healthy upside velocity without reaching overbought territory. Should bulls clear $4,190.00 on a 4-hour candle close, the path opens toward the $4,393.00 secondary upside target, marked by the September 11 and 18 reaction peaks. Meanwhile, $4,112.00 and $4,070.00 serve as line-in-the-sand downside support floors.
Fundamentals
The catalyst driving gold’s rebound from the $4,070.00 low is a temporary breather in the US dollar rally, alongside a pullback in benchmark 10-year Treasury yields from multi-decade peaks around 5.30%. Macro risk sentiment remains cautious as markets digest sustained geopolitical friction in the Middle East and energy market volatility, keeping safe-haven interest supportive of bullion demand. However, sticky global inflation metrics, with US headline CPI hovering around 3.4% YoY, continue to keep central bank rate expectations elevated, capping aggressive rallies. Central bank physical buying and stabilising institutional ETF inflows provide an underlying demand backstop near the $4,070.00 structural floor. As a result, gold is operating in a sensitive macro balance between high real yields and persistent geopolitical risk hedging.
Bottom line
Market conviction favours a continuation test of the $4,190.00 breakout trigger as long as price holds above the $4,112.00 intermediary support base. A 4-hour close above $4,190.00 confirms a broader recovery push toward $4,393.00 over the coming one to two weeks, whereas a break below $4,112.00 invalidates the immediate bullish momentum and reopens a test of the $4,070.00 floor. Traders should monitor upcoming US consumer sentiment releases, Federal Reserve commentary and Treasury yield direction heading into next week’s trading.

.webp?format=pjpg&auto=webp&width=1536&quality=75&branch=main)
Jack McKay | Eightcap Risk Manager
Jack McKay is Eightcap's Simulated Trading Risk Manager.
Related articles

Trade gold CFDs 24/7 with GOLD247
Trade GOLD247, Eightcap's Gold/USD CFD, seven days a week.
17 August 2026

How to trade gold
Learn how gold trading works, what moves gold prices, five ways to gain exposure and how to trade gold step by step while managing risk.
17 August 2026

The six factors that drive Gold prices
What drives the price of Gold? Gold is considered to be a safe haven asset during periods of market volatility.
27 February 2020


